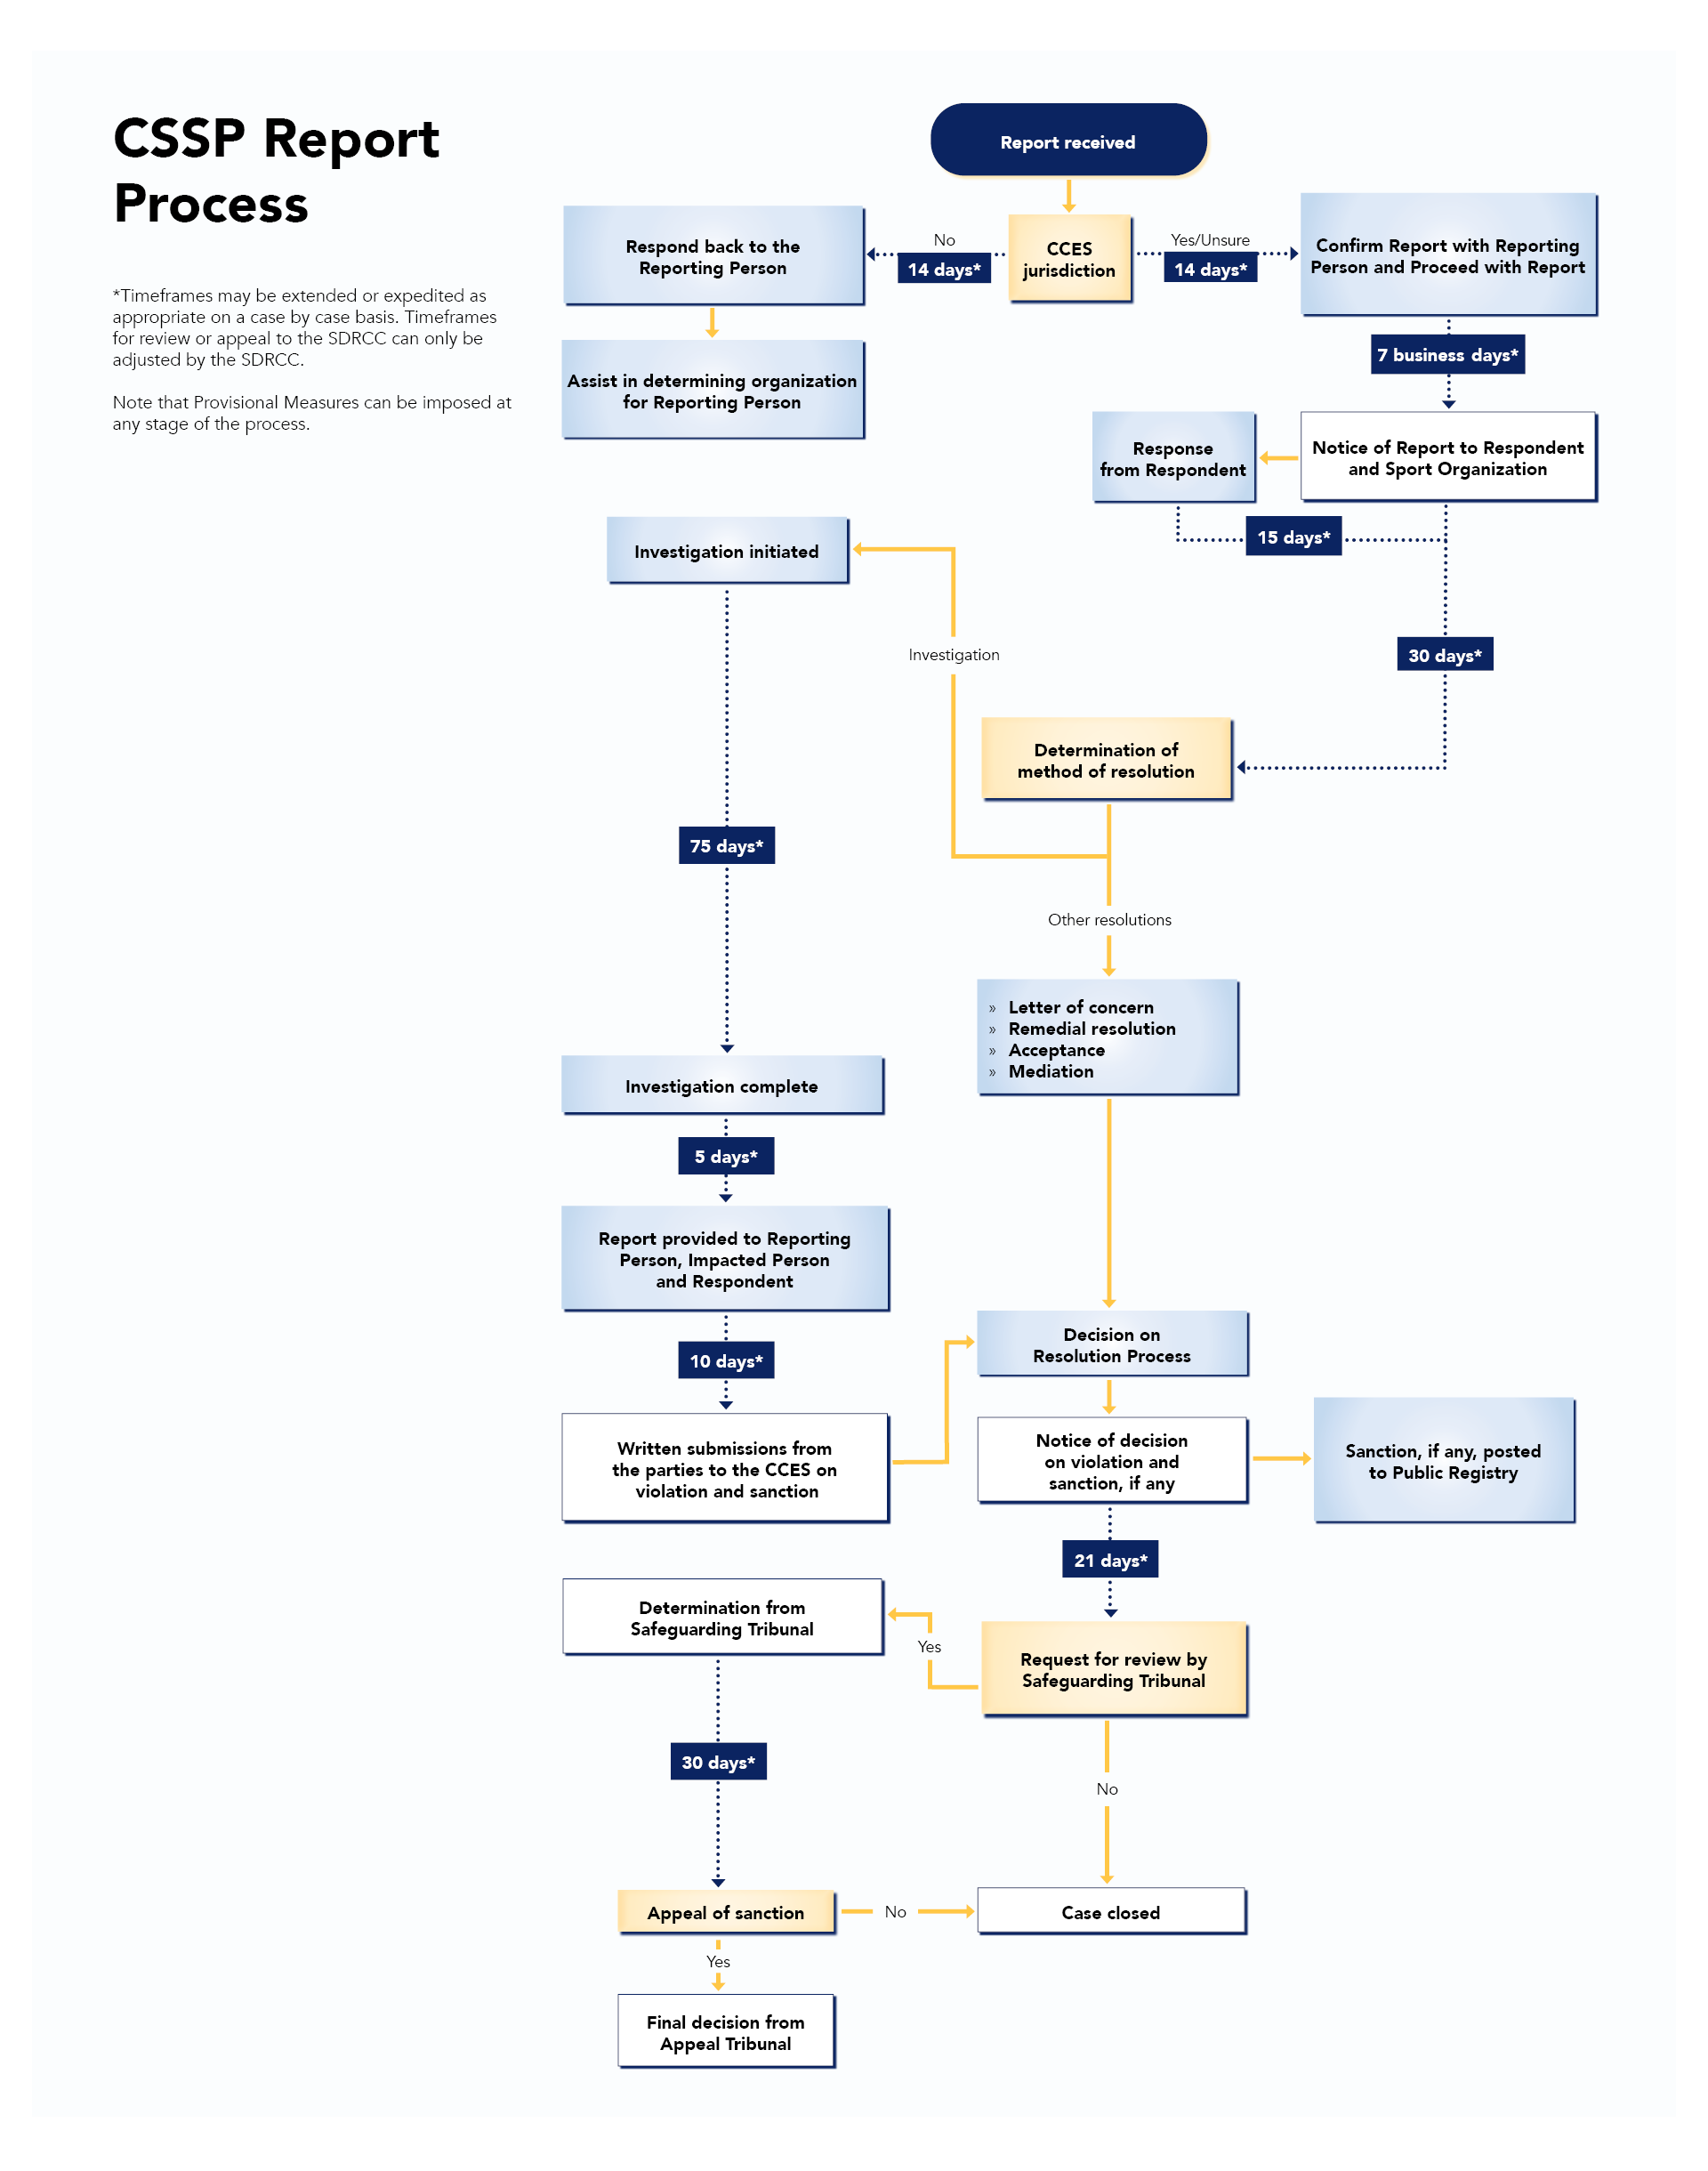
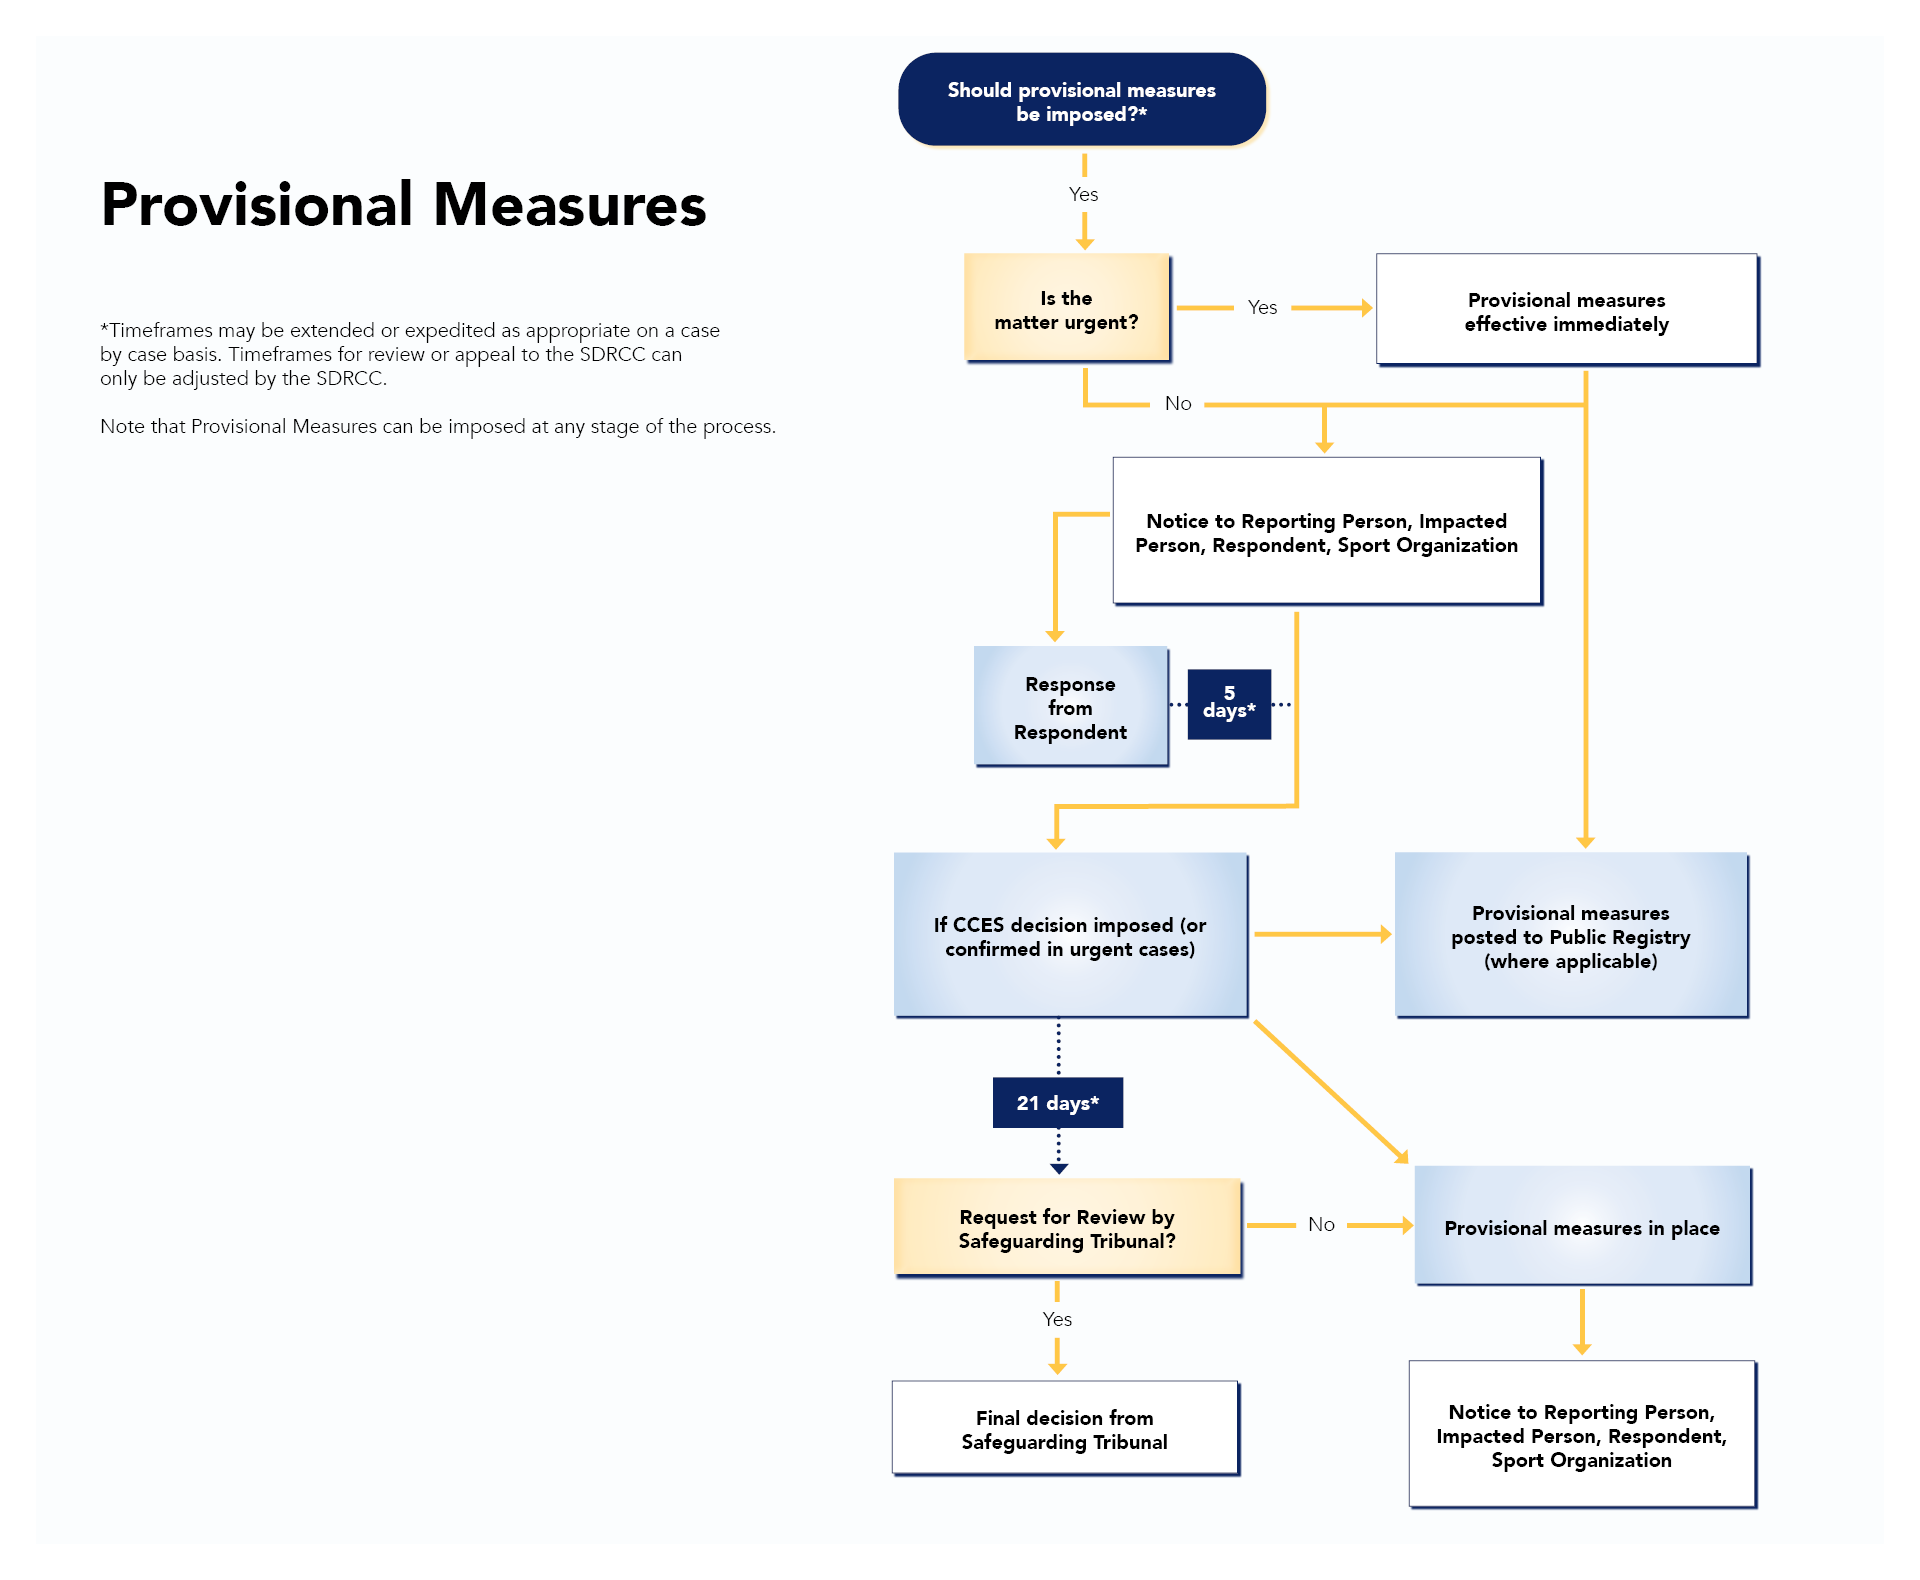
These charts outline the report process and possible outcomes. The length of time a report will take depends on many factors, but there are established timelines for every stage of the process.
For more information about the report process, please consult the CSSP Rules.
Report Process
The following chart shows the paths a report could take and the decision points in the CSSP report process.
Click the image below to open the report process flow chart:
Provisional Measures
The following chart shows the decision path if provisional measures are needed at the initial stage of the report process. Provisional measures can also be implemented by the CCES at any point during the process.
Click the image below to open the provisional measures flow chart:

